Data-science capstone
Oceans Rise, Properties Fall
Quantifying the economic loss projected sea level rise will force on Florida’s housing market—and mapping where it lands first.
Malcolm Xavier, with Alex De Mouy, Jacob Kasner, and Fernando Narbona
This was our capstone for Data Science for All (opens in new tab) (DS4A), Correlation One’s applied data-science program. Four of us spent the program on a single question: how do you put a dollar figure on what rising seas will take from Florida’s housing market—one of the largest asset markets contributing to global wealth?
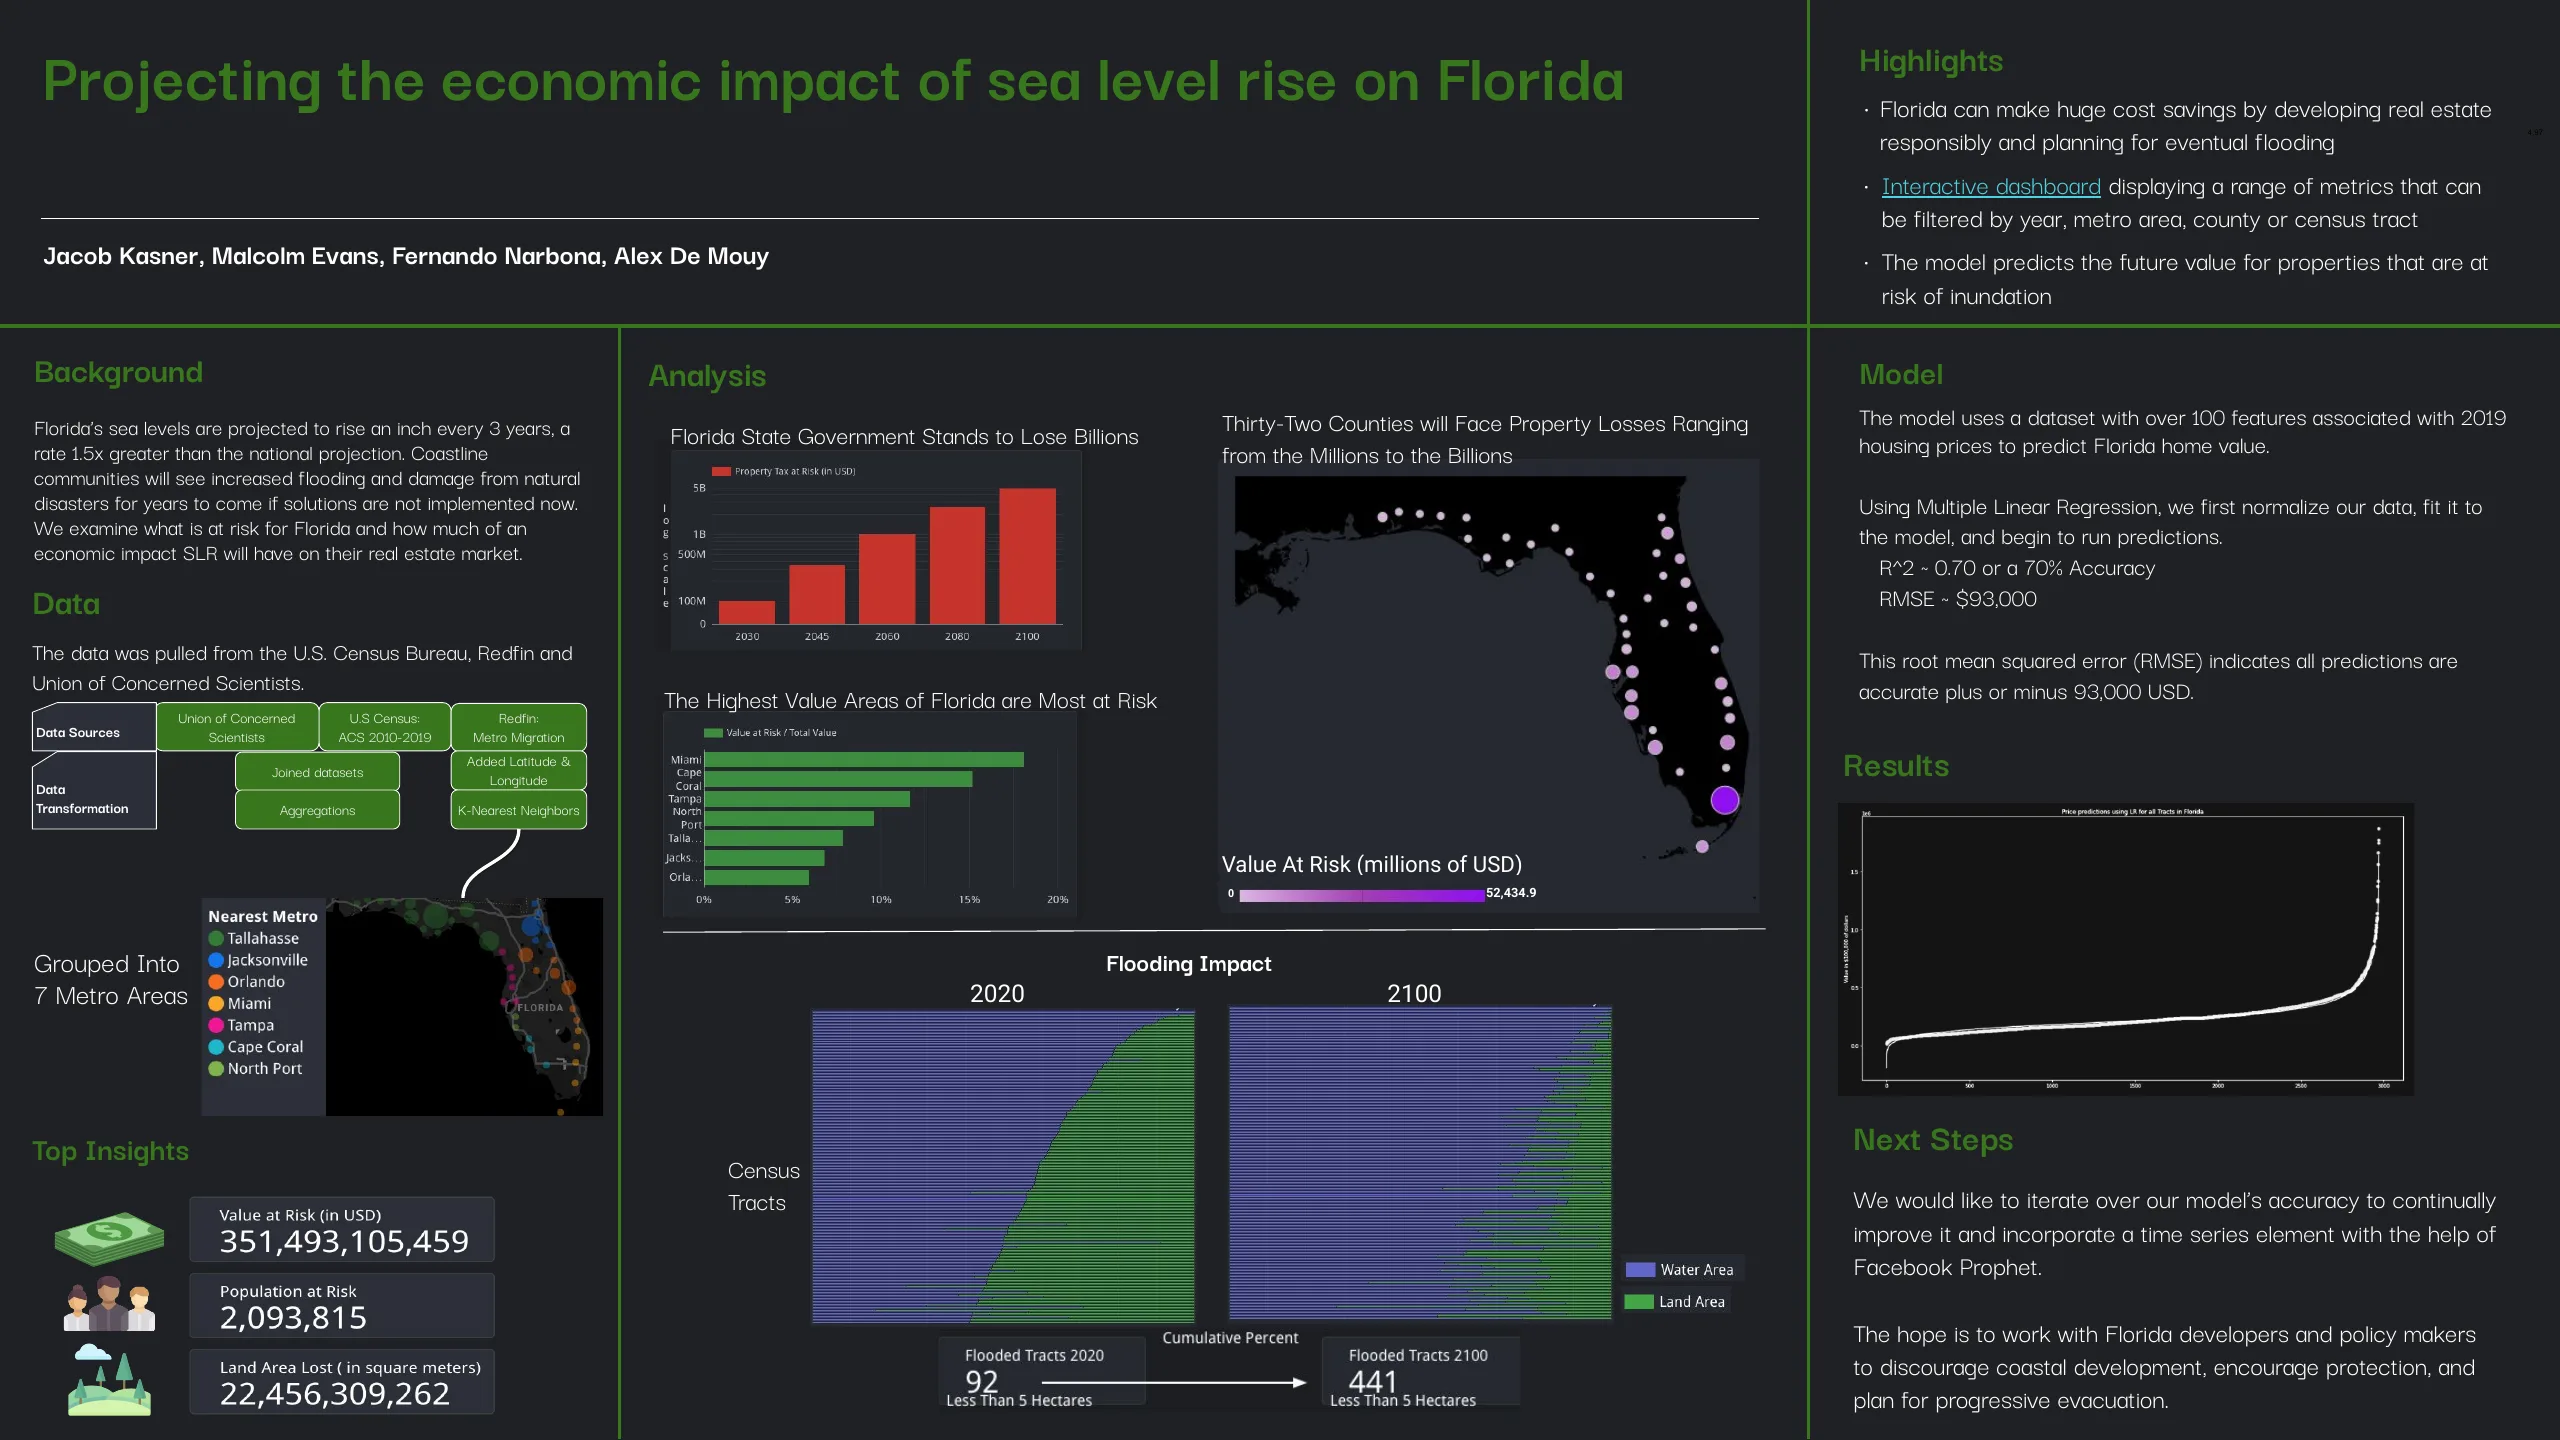
We assembled a dozen public datasets, modeled residential property values, projected loss out to 2100, and shipped an interactive dashboard aimed at the people who could actually act on it: city planners and developers. The headline we landed on is blunt. Within ten years, sea level rise reaches every county in the Miami, Cape Coral, North Port, and Tampa metro regions—an area of 22,456,309,262 square meters, representing $351,493,105,459 in property value and housing 2,093,815 people.
The question
For hundreds of years we have traded the environment for economic “progress.” One bill now coming due is sea level rise, which will force coastal areas and their inhabitants inland—and with them, an enormous quantity of real estate. In the last 60 years, sea level has risen 6 inches nationally; over the next 20 it is projected to rise another 6. South Florida, now called sea-level-rise “ground zero,” is rising faster still—about an inch every 3 years, more than 1.5× the national rate. As recently as 2019, an estimated (opens in new tab) 3.5 million Floridians were already at risk from coastal flooding.
The exposure is not only coastal. 94.7 million Americans—28.6% of the population (opens in new tab)—live in coastal regions and could migrate inland as flooding claims homes, and the landlocked states that border the coasts are not ready for that influx. Our project set out to identify the at-risk areas, estimate total property loss across time, and give developers and policymakers a reason to invest inland and rebuild consciously.
The data we assembled
No single source answers the question, so we joined several. Census cartographic boundary files (opens in new tab) gave us land and water area by tract; population and housing-unit counts came in at the tract level; the Union of Concerned Scientists (opens in new tab) supplied inundation, property-tax, and economic-impact projections by county and year; Redfin (opens in new tab) migration data let us group counties by their nearest metro; the USGS (opens in new tab) National Elevation Dataset gave us a median elevation per county; and the American Community Survey provided ten years of housing-value history (2010–2019) for the price model. We filtered flooding projections to the high-severity scenario throughout—the worst case is the one worth planning against.
The model, and where it broke
The price model is where the work got honest. Real-estate data is heavily privatized, so the Census was the best public source we could find—and it came with collinearity baked in. We reduced from roughly 150 features to about 60 by hand using domain knowledge, then used scikit-learn’s SelectKBest to cut further; our best results held at 10 features, which still carried some collinearity that further reduction wouldn’t resolve. We proceeded with eyes open. Standardizing the variables and fitting a simple linear regression gave an R² of about 70% and an RMSE of roughly $93,000—a decent-but-imperfect fit, enough to show the data could be modeled as a function we could push further.
To project prices decades into the future we turned to FB Prophet, a time-series library with seasonality already built in—chosen as much for our time constraints as its fit. Two limits surfaced fast. Testing across every tract pushed runtime past four hours, so we aggregated up to the county level. And with only ten annual data points per series, projecting eighty years out produced unrealistic trends—negative house prices included—until we added a smoothing step and swept a combinatorial grid of hyperparameters to tame them. Even then, Prophet predicted accurately for only about 13 of our 68 counties. Naming that ceiling is the point: we built a working pipeline, and we can tell you exactly where it stops being trustworthy.
What the numbers said
Within ten years, sea level rise affects every county in the Miami, Cape Coral, North Port, and Tampa metro regions—22,456,309,262 square meters at risk, $351,493,105,459 in property value, and a population of 2,093,815. By 2021, 6 of 32 affected coastal counties were projected to be chronically more than 90% inundated. The displacement radiates outward: the interstate migration pressure lands hardest on Georgia, Texas, California, Tennessee, and Virginia, each of which inherits a direct hit to its economic resources. Absent coordinated action between government and developers—climate policy, sea-wall infrastructure—sizeable parts of Florida simply cease to exist.
The honest caveat rides alongside the figure. Collinearity persists in the most robust dataset we could find, because the data we truly needed is privatized and costly. We reduced the feature set substantially and fit the regression at R² ≈ 70%; the forward price projection was only partly successful. The point estimate is real and defensible; the eighty-year forecast is a direction, not a promise.
Future work
The models here should be extended to other coastal states to build a regional and national picture—one that, on similarly trending findings, could warrant federal recommendation. Carbon-emissions data should be folded in so the model can measure how effective different climate responses actually are, rather than only sizing the damage. And the social dimensions deserve their own reporting: the potential for full displacement, for people becoming unhoused, and for gentrification—so that any proposal to a government or development office carries the human cost alongside the property one.
Read the full work
- Download the full report ↓ (opens in new tab)PDF · 490 KB
- Download the datafolio ↓ (opens in new tab)PDF · 399 KB